May 14 incident postmortem: high IO latency on some instances
2024-06-03
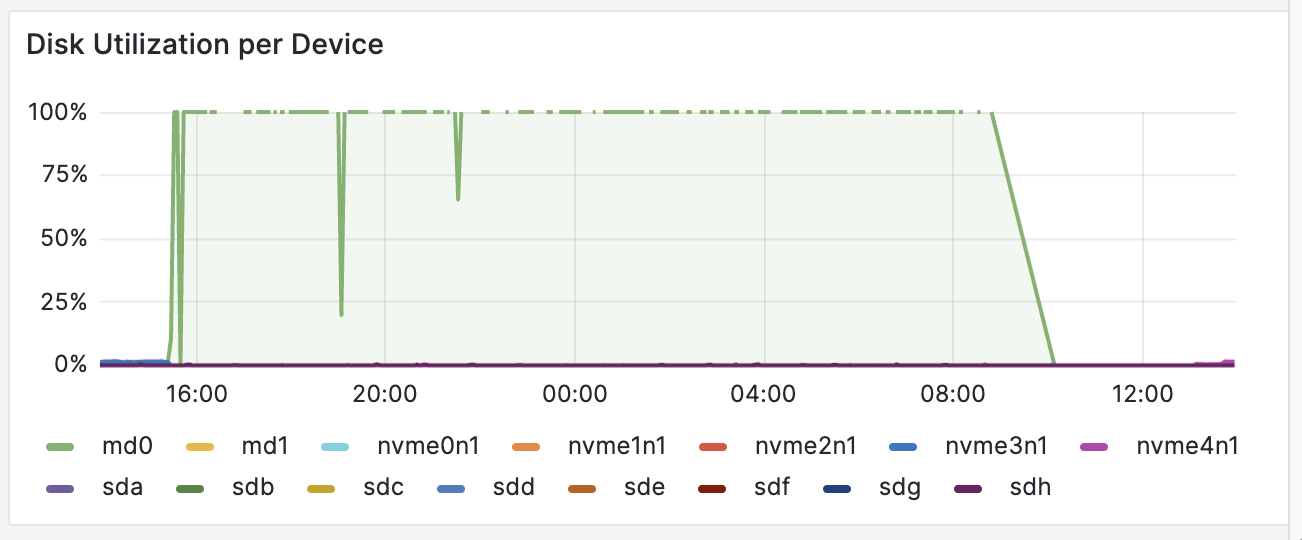
Starting around 15:00 UTC on the 24th, disk write latency began to increase for instances on a single hypervisor, eventually reaching critical levels. We started migrating affected workloads to different hypervisors where the same phenomenon began to occur over the next handful of hours.
Our initial guess was a hardware failure, but a scan for hung tasks revealed the following:
       1161 ?        D      6:15 [xfsaild/md0]
    3471559 ?        D      0:00 [kworker/u64:1+flush-9:0]
    3475932 ?        D      0:00 [kworker/u64:2+flush-9:0]
    3481435 ?        D      0:00 [kworker/u64:0+flush-9:0]
    3482415 ?        D      0:01 [kworker/14:1+md]
    3482863 ?        D      0:00 [kworker/u64:3+flush-9:0]
    3483173 ?        D      0:00 [kworker/14:2+xfs-sync/md0]
    3483219 ?        D      0:00 [kworker/u64:4+flush-9:0]
    3483228 ?        D      0:00 [kworker/u64:5+flush-9:0]
    3483356 ?        D      0:00 [kworker/u64:6+flush-9:0]
    3483358 ?        D      0:00 [kworker/u64:7+flush-9:0]
    3483360 ?        D      0:00 [kworker/u64:8+flush-9:0]
    3483361 ?        D      0:00 [kworker/u64:9+flush-9:0]
    3483362 ?        D      0:00 [kworker/u64:10+flush-9:0]
    3483370 ?        D      0:00 [kworker/u64:12+flush-9:0]
    3483373 ?        D      0:00 [kworker/u64:13+flush-9:0]
    3483412 ?        D      0:00 [kworker/u64:15+flush-9:0]
    3485774 ?        D      0:00 [md0_resync]
Scanning the stack traces revealed a pattern of stalled requests:
    [<0>] raid5_get_active_stripe+0x25a/0x2f0 [raid456]
    [<0>] make_stripe_request+0x95/0x350 [raid456]
    [<0>] raid5_make_request+0x16f/0x3e0 [raid456]
    [<0>] md_handle_request+0x12e/0x220

    ...

    [<0>] md_flush_request+0x9b/0x190
    [<0>] raid5_make_request+0x38b/0x3e0 [raid456]
    [<0>] md_handle_request+0x12e/0x220
rendering the software RAID layer unable to write to the underlying hard drives which were completely healthy.
With a better understanding of the problem in-hand, we began the search for a fix. After finding and loading a relevant kernel patch, the error rates ceased to return.
No data was lost during the incident.
Our team handled the incident with care and professionalism, posting frequent updates to our status page. We’ve also added additional alerts to our monitoring system to more quickly identify similar situations.
Thanks as always for your feedback and support!